Machine Learning for Cell Migration
Methodology
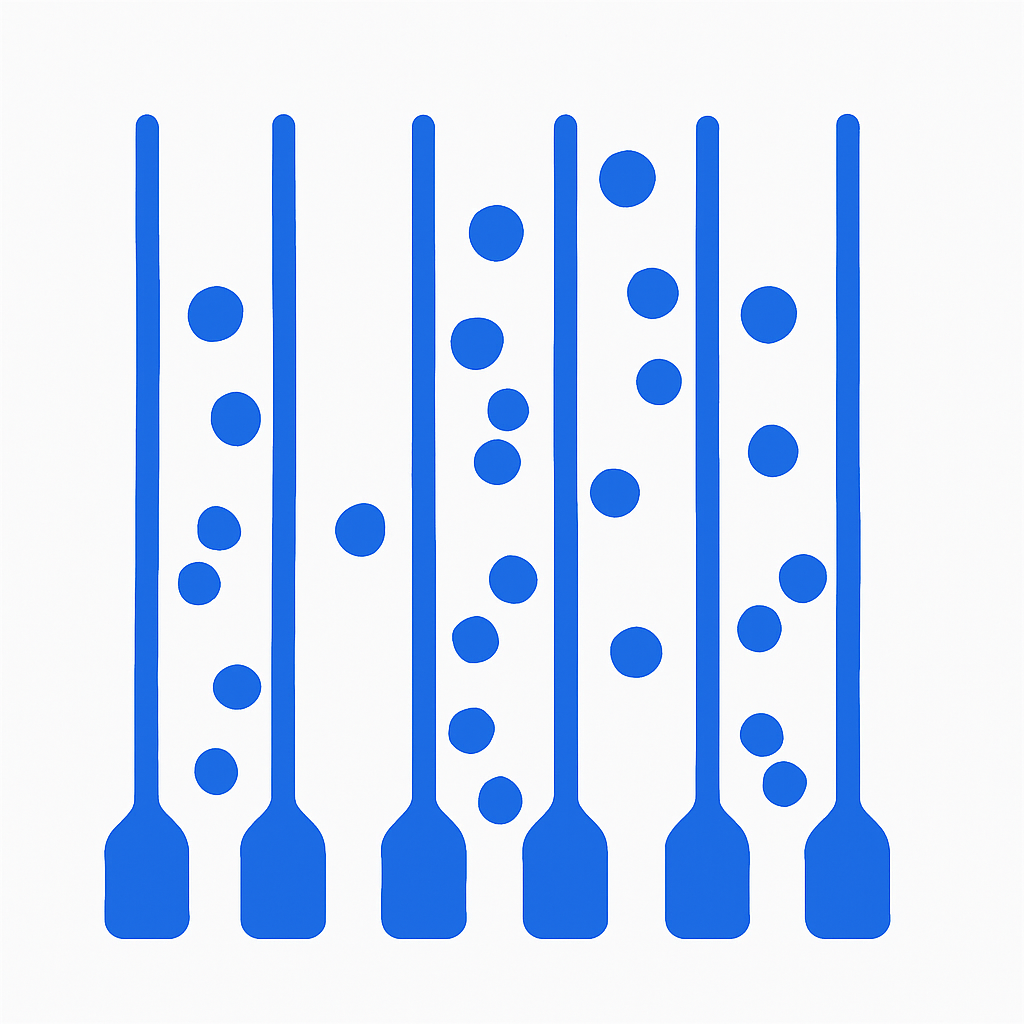
Cells through microfluidic device
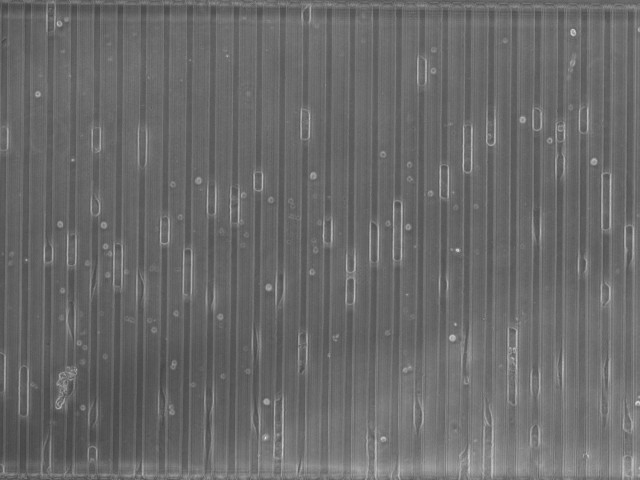
Image of a microfluidic device featuring a channel with a width comparable to that of a single cell. This design enables the precise confinement and analysis of individual cell behavior as they migrate through the channel.
Preprocessing

The plot displays the quadratic fit (blue curve) representing the outlier removal region as a function of the number of detected contours. Data points outside this region are considered outliers and are excluded from further analysis. The shaded area indicates the confidence interval for the quadratic fit.
Cells trajectories

The plot illustrates the trajectories of individual cells migrating within a specific microfluidic channel. Each path represents the movement of a single cell over time, highlighting the diversity and dynamics of cell migration patterns observed under the experimental conditions.
Publication list
Partners

Funding


The Executive Agency for Higher Education, Research and Innovation Funding